2016 Third Quarter Report: The Bull Continues
2016 Third Quarter Report
The Bull Continues…
100 days after the Brexit scare, three quarters of a year after the most recent Fed rate hike, the markets once again confounded the instincts of nervous investors and went up instead of down. Last week, Fed Chairperson Janet Yellen told the world that the U.S. economy is healthy enough to weather a rise in interest rates, but the Fed governors met in September and declined to serve up the first rate hike since last December 15. That was reassuring news to the Wall Street traders, and investors generally, helping to provide yet another quarter of positive gains in U.S. stocks.

The Wilsire 5000 Total Market Index–the broadest measure of U.S. equities—gained 4.53% for the third quarter, and is now up 8.39% for the first three quarters of the year. The comparable Russell 3000 index was up 4.40% for the quarter and is sitting on 8.18% gains so far this year.
Larger companies posted the lowest gains. The Wilshire U.S. Large Cap index was up 3.92% in the third quarter of 2016, putting it at a positive 8.01% since the beginning of January. The Russell 1000 large-cap index provided a 4.03% return over the past quarter, with a gain of 7.92% so far this year, while the widely-quoted S&P 500 index of large company stocks posted a gain of 3.31% in the third quarter, and is up 6.08% for the year so far.
Meanwhile, the Wilshire U.S. Mid-Cap index was up 4.35% for the quarter, and is sitting on a positive gain of 11.31% for the year. The comparable Russell Midcap Index gained 4.52% for the quarter, and is up 10.26% for the year.
Small company stocks, as measured by the Wilshire U.S. Small-Cap index, gave investors a 7.67% return during the third quarter, up 13.03% so far this year. The comparable Russell 2000 Small-Cap Index gained 9.05%, posting an 11.46% gain so far this year, while the technology-heavy Nasdaq Composite Index gained 9.67% for the quarter and is up 6.06% heading into the final quarter of 2016.
What’s Happening Abroad?
Looking abroad, the U.S. remains a haven of stability in a very messy global investment scene. The broad-based EAFE index of companies in developed foreign economies gained 5.80% in dollar terms in the third quarter of the year, but is still down 0.85% for the first three-quarters of the year. In aggregate, European stocks have lost 2.67% so far in 2016. Far Eastern stocks are up just 1.73% for the year. In contrast, a basket of emerging markets stocks domiciled less developed countries, as represented by the EAFE EM index, gained 8.32% for the quarter, and are sitting on gains of 13.77% for the year so far.
Looking over the other investment categories, real estate investments, as measured by the Wilshire U.S. REIT index, were down 1.21% for the third quarter, but still enjoy a gain of 9.75% for the year. Commodities, as measured by the S&P GSCI index, lost 4.15% of their value in the third quarter, but are sitting on gains of 5.30% for the year so far.
On the bond side, the interest rate story is essentially unchanged: rates are still low, once again confounding all the experts who have been expecting significant rate rises for more than half a decade now. 10-year U.S. government bonds are currently yielding 1.59%. Three-month notes were yielding 0.27% at the end of the quarter, while 12-month bonds were paying just 0.58%. Go out to 30 years, and you can get a 2.32% annual coupon yield.
Restrained Stock Prices
What’s keeping stock prices high while sentiment appears to be—let’s call it “restrained?” Nobody knows the answer, but a deeper look at the U.S. economy suggests that the economic picture isn’t nearly as gloomy as it is sometimes reported in the press. Economic growth for the second quarter has been revised upwards from 1.1% to 1.4%, due to higher corporate spending in general and especially as a result of increasing corporate investments in research and development. America’s trade deficit shrank in August. Consumer spending—which makes up more than two-thirds of U.S. economic activity, rose a robust 4.3% for the quarter, perhaps partly due to higher take-home wages this year.
Meanwhile, if someone had told you five years ago that today’s unemployment rate would be 4.9%, you would have thought they were highly optimistic. But after the economy gained 151,000 more jobs in August, unemployment remained below 5% for the third consecutive month, and the trend is downward. At the same time, average hourly earnings for American workers have risen 2.4% so far this year.
Based on their reading of the Treasury yield curve, economists at the Federal Reserve Bank of Cleveland have pegged the chances of a recession this time next year at a low 11.25%. They predict GDP growth of 1.5% for this election year—which, while below targets, is comfortably ahead of the negative numbers that would signal an economic downturn. (In general, a steep yield curve has been a predictor of strong economic growth, while an inverted one, where short-term rates are higher than longer-term yields, are associated with a looming recession.)
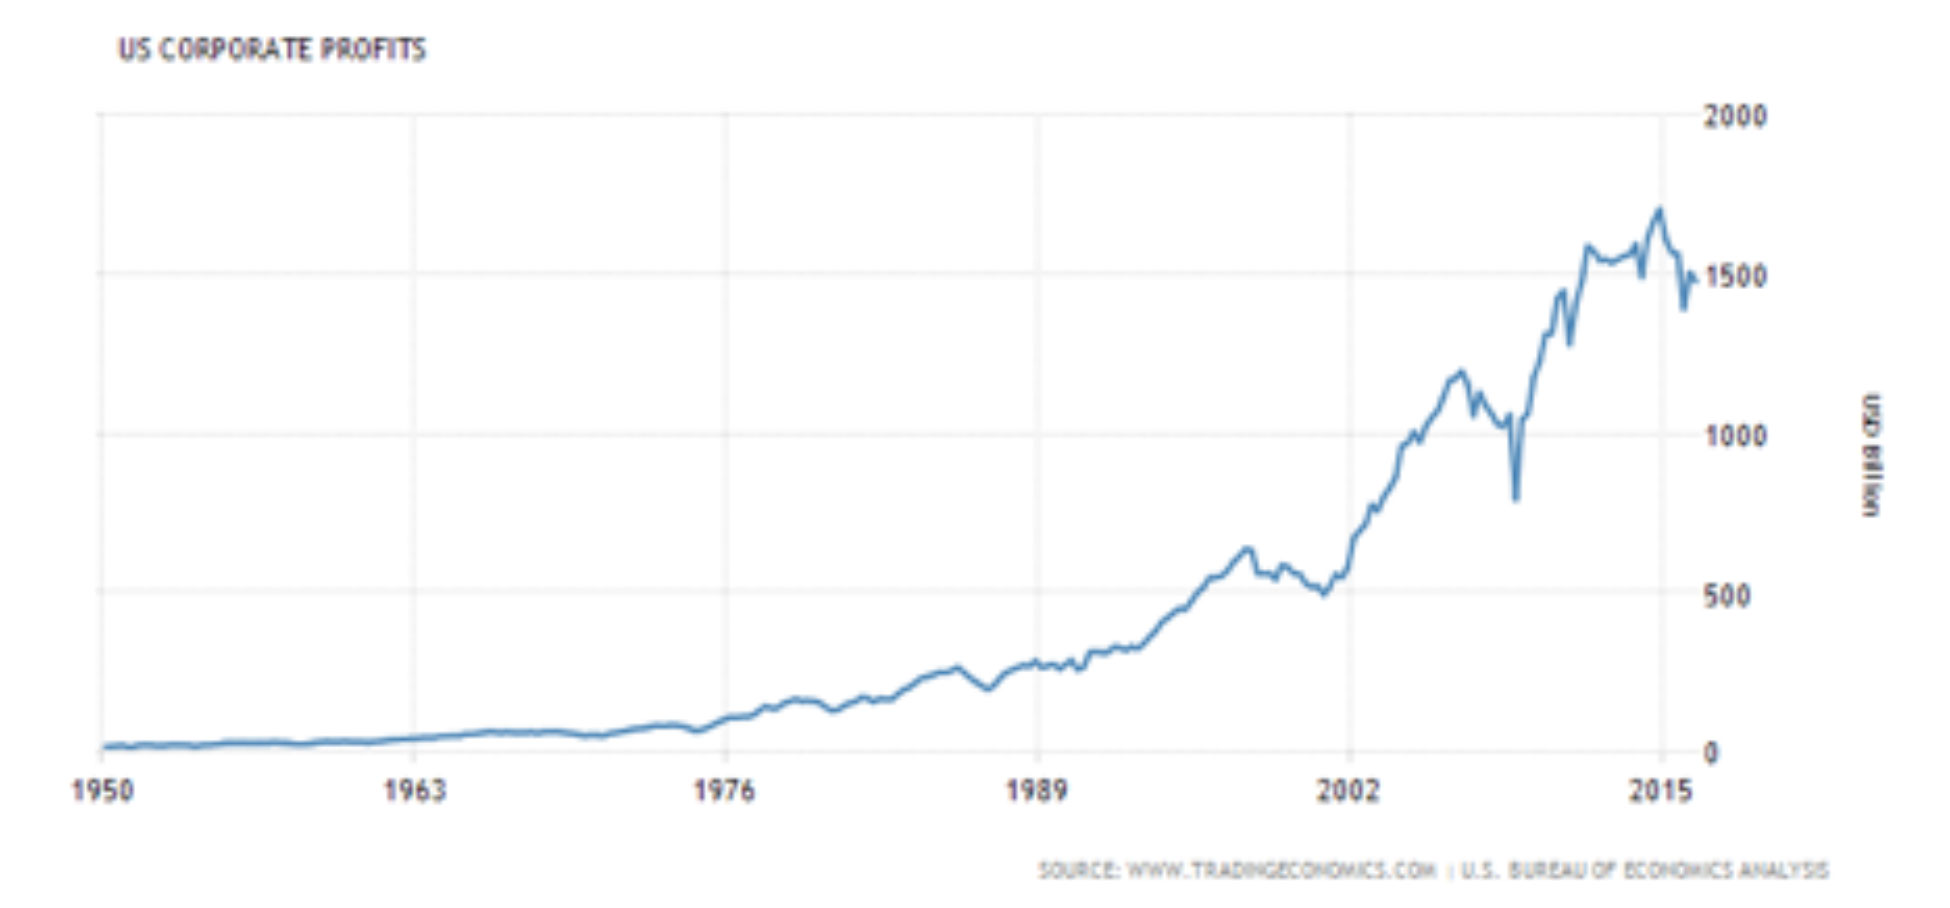
On top of everything else, as you can see from the accompanying chart, corporate profits have been on a long-term upswing, even if the rise has been choppy since 2008. Will this long-term trend continue? Who knows?
The U.S. returns have been so good for so long that many investors are wondering: why are we bothering with foreign stocks? A recent Forbes column suggested the answer: historically, since 1970, foreign stocks have outperformed domestic stocks almost exactly 50% of the time, meaning the long trend we’ve become accustomed to could reverse itself at any time.
Nobody would dispute that the economic statistics are weak tea leaves for trying to predict the market’s next move, and it is certainly possible that the U.S. and global economy are weaker than they appear. But the slow, steady growth we’ve experienced since 2008 is showing no visible signs of ending, and it’s hard to find the usual euphoria and reckless investing that normally accompanies a market top and subsequent collapse of share prices. At the current pace, we might look back on 2016 as another pretty good year to be invested, which is really all we ask for.
Sources:
Wilshire index data. http://www.wilshire.com/Indexes/calculator/
Russell index data: http://indexcalculator.russell.com/
S&P index data: http://www.standardandpoors.com/indices/sp-500/en/us/?indexId=spusa-500-usduf–p-us-l–
Nasdaq index data: http://quicktake.morningstar.com/Index/IndexCharts.aspx?Symbol=COMP
International indices: http://www.mscibarra.com/products/indices/international_equity_indices/performance.html
Commodities index data: http://us.spindices.com/index-family/commodities/sp-gsci
Treasury market rates: http://www.bloomberg.com/markets/rates-bonds/government-bonds/us/
Aggregate corporate bond rates: https://indices.barcap.com/show?url=Benchmark_Indices/Aggregate/Bond_Indices
Aggregate corporate bond rates: http://www.bloomberg.com/markets/rates-bonds/corporate-bonds/
https://www.yahoo.com/news/yellen-defends-tougher-banking-regulations-141913276.html
http://www.bls.gov/news.release/pdf/empsit.pdf
https://www.yahoo.com/news/u-economy-less-sluggish-2nd-165152063.html
http://www.tradingeconomics.com/united-states/corporate-profits
https://www.clevelandfed.org/our-research/indicators-and-data/yield-curve-and-gdp-growth.aspx


