Eerily Quiet on the Market Front
 Eerily Quiet on the Market Front
While the U.S. stock market tests new highs, and valuations keep rising farther above long-term averages, you may not have noticed something very odd about our current bull market. The last six and a half years have set a record for lowest market volatility, and the past 299 trading days, starting in November of 2016, has set an even bigger non-volatility record. The markets have been eerily quiet for longer than they ever have been before.
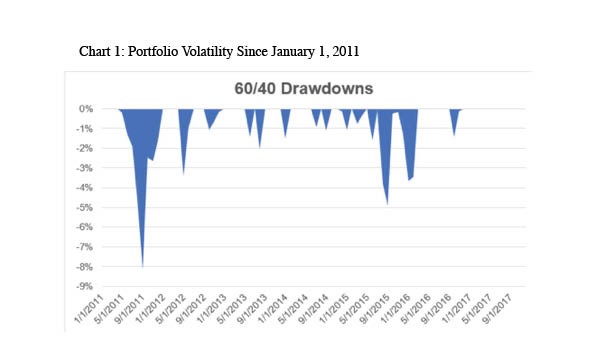
To see what this means, look at the first chart, which shows the losses (aka “drawdowns” in professional investorspeak) for stock market investors since January 1, 2011. The blue spaces represent market pullbacks—a euphemism for temporary losses—that a 60/40 (U.S. stocks/U.S. bonds) has experienced over the last six years. Two things jump out at you; first, investors in this very basic portfolio haven’t experienced portfolio losses greater than 5% since September of 2011—more than six years ago. Even spookier is the back end of the chart, which shows essentially zero drawdowns since the end of last January.
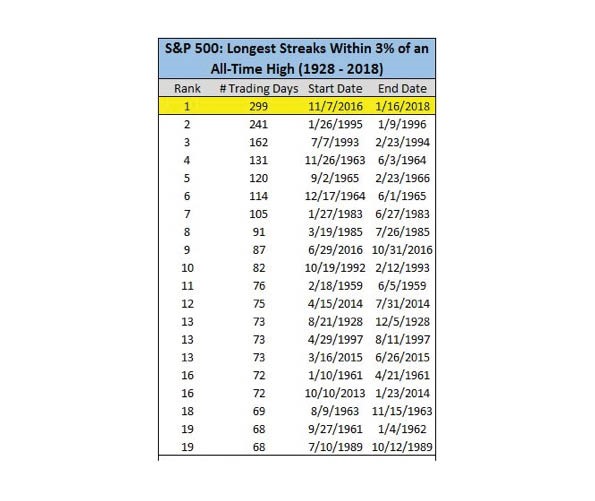
 The second chart illustrates the longest time periods when the markets remained within 3% of an all-time high, which basically means that there were gains without a significant downturn. The previous record, 241 trading days, was set between late January 1995 and early January 1996, and the chart shows other records going back to 1961. The longest streak, which is still ongoing, is the time period since November 7, 2016.
What does this mean? It’s impossible to predict the future based on this kind of data, but it does indicate that the U.S. investment markets have been behaving strangely, and it suggests that we are long overdue for at least a moderate correction. When that will come remains a bit of a mystery, so let’s celebrate our good fortune up to now, and recognize that it won’t last forever.


