Diversifying Your Portfolio With Midcap Stocks
 Long eclipsed by their bigger and smaller brothers, midcap stocks clearly suffer an image problem. Most have yet to achieve the universal coverage and broad visibility of large caps, but they lack the nimble reputation of small caps to potentially generate rapid earnings and share price growth. Yet these same characteristics are what make midcaps an ideal middle ground for investors looking to potentially reap the best of both worlds.
What Are Midcap Stocks?
Not surprisingly, midcap equities represent ownership in medium-sized companies. The value of a company’s stock is known as its market capitalization, or market cap, defined as its share price multiplied by the number of shares outstanding. Midcap stocks are typically deflned as those with market capitalizations ranging from $3 billion to $10 billion, although ranges vary. Note that this definition changes over time as the value of the overall market shifts.
Because midcap stocks are typically issued by established companies with experienced management, they are usually considered less risky than small-cap stocks. They also may be more stable after surviving the transition from small business to larger company. And because they usually have an established track record, research about mid-sized companies — crucial to determining an investment’s potential — is usually readily accessible.
On the other hand, because they’re medium-sized, there’s often still room for growth as they strive to gain more market share and become dominant in their industry. After all, most of today’s blue-chip stocks were once midcaps.
Evaluating the Numbers
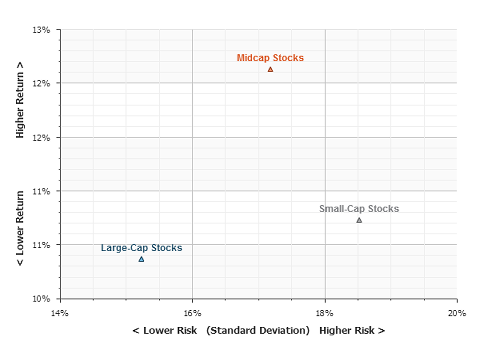
While the spotlight often shines on large-cap stocks (they comprise more than 80% of the equities market based on market value), midcap stocks (which account for less than 10% of the market) have historically been kind to long-term investors. For the 30 years ended December 31, 2015, midcap stocks returned an annualized 13.31% while large-cap stocks rose 10.37% and small-cap stocks increased 10.73%.1
Performance, however, is just one consideration when investing. Risk is another important factor. Over that same 30-year period, the standard deviation (a historical measure of volatility) of midcap stocks was 17.18% compared with 15.23% and 18.52% for large caps and small caps, respectively. And the combined risk/return profile, or Sharpe ratio, is also favorable for midcap stocks (see chart). Although past performance is not a guarantee of future returns, these statistics make a compelling historical case for owning stocks of medium-sized companies.1
| Measuring the Risk/Reward Trade-Off1 |
| This chart shows that over the last 30 years, midcap stocks outperformed other categories of domestic equities, producing the best annualized return without an excessive amount of risk. Remember, however, that past performance cannot guarantee future results. |
 |
Spreading Risk
Perhaps the best reason to consider including midcap stocks in a portfolio can be summed up in one word: diversification. Doing so means you’ll own different types of stocks, which may potentially help reduce risk. Why? Because different investments perform better during different phases of the market cycle. Purchasing a variety of investments helps spread the risk and may help cushion your portfolio from short-term market swings.
You can diversify further by buying a mix of growth and value stocks in each size category. Some years, growth stocks outperform. For example, in 2007, midcap growth stocks returned 13.5% while midcap value stocks gained only 2.7%. However, in 2014, midcap growth stocks gained only 7.6% while midcap value stocks gained 12.1%.2
Another way to diversify your portfolio with midcap stocks is to invest in a midcap mutual fund. Such funds are naturally diversified because they invest in many midcap companies. Additionally, midcap mutual funds come in a variety of styles and are professionally managed.
Finally, be sure to review all of your investments once a year with a qualified financial professional. Among the items on your to-do list, you’ll want to check that your investments are still compatible with your financial goals.
Source/Disclaimer:
1Source: ChartSource®, DST Systems, Inc. For the period from January 1, 1986, through December 31, 2015. Large-cap stocks are represented by the S&P 500 index. Midcap stocks are represented by a composite of the CRSP 3d-5th deciles and the S&P 400 index. Small-cap stocks are represented by a composite of the CRSP 6th-10th deciles and the S&P 600 index. It is not possible to invest directly in an index. Past performance is not a guarantee of future results. Copyright © 2016, DST Systems, Inc. All rights reserved. Not responsible for any errors or omissions. (CS000136)
2Source: DST Systems, Inc. Midcap growth and value stocks are represented by the S&P MidCap 400 Growth and Value indexes. These unmanaged indexes are considered representative of their respective markets. Indexes do not take into account the fees and expenses associated with investing, and individuals cannot invest directly in any index. Past performance cannot guarantee future results.
Because of the possibility of human or mechanical error by Wealth Management Systems Inc. or its sources, neither Wealth Management Systems Inc. nor its sources guarantees the accuracy, adequacy, completeness or availability of any information and is not responsible for any errors or omissions or for the results obtained from the use of such information. In no event shall Wealth Management Systems Inc. be liable for any indirect, special or consequential damages in connection with subscriber’s or others’ use of the content.
© 2016 DST Systems, Inc. Reproduction in whole or in part prohibited, except by permission. All rights reserved. Not responsible for any errors or omissions.


