Auto Sales vs. The Economy

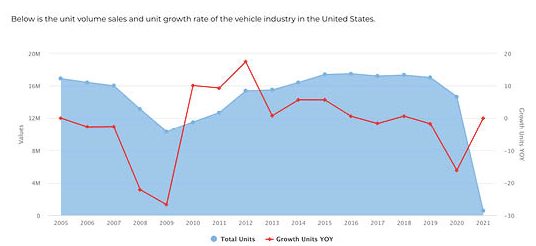
One of the bellwether indicators of the health of the U.S. economy is automotive sales; when Americans are feeling confident and financially secure, they are more inclined to buy a new car than when they’re pessimistic and financially strapped. The last time we experienced a recession, back starting in 2008, auto sales fell from well over 16 million vehicles in 2005, 2006 and 2007 to just over 12 million in 2008 and a little over 10 million in 2009. We didn’t get back above 16 million in total auto sales until six years later, in 2015.

You can see from the chart, which shows total sales in the blue area, that auto sales were falling even before the pandemic recession—although the chart looks more alarming than it should, because the 2021 drop only reflects one quarter of sales. The red line shows that sales are recovering somewhat, but from an unfortunate decline. The strong suggestion: despite what you may hear from the pundits, the U.S. economy is not very healthy.
The biggest losers appear to be Ford, General Motors and Honda, while Toyota Subaru and Hyundai were able to maintain (barely) their sales numbers of the previous year. This follows an interesting trend: General Motors’ share of the U.S. car market has declined from just over 25% in 2005 to just 17% last year. Over the same time period, Ford’s share of U.S. auto sales has fallen from more than 17% down to just under 14%. The company with the fastest-growing market share, albeit from as very small start, is Tesla, which owned a minuscule 0.11% of the U.S. market in 2015, and managed to claim roughly 2% of all U.S. auto sales last year: 292,902 cars in all.


