World Stock Markets: Then and Now
Shifting Economic Balance
Ever wonder how the balance of the world stock markets have changed over the last 120 years?
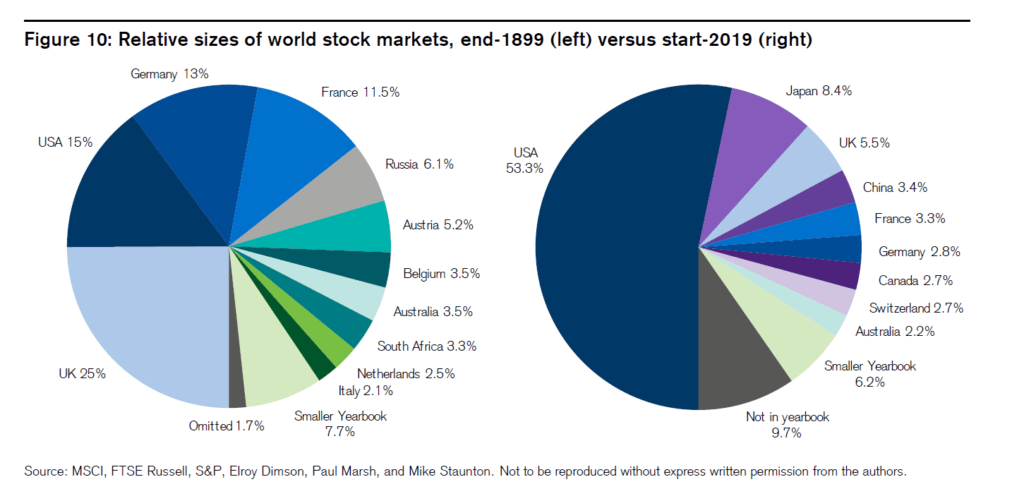
Here’s a really interesting snapshot (see graphic), which shows the size of many countries’ stock markets at the beginning of the 1900s (as a percentage of the total), and as of the start of this year. Notice the enormous growth of the U.S., from 15% of the total to more than 50%. Also notice that much of this growth came at the expense of European economies, notably the UK (down from 25% to 5.5% over the past 120 years), Germany (13% down to 2.8%) and France (11.5% to 3.3%). Russia and Austria were significant at the end of 1899; less so now.
Also notice some of the risers: Canada, Switzerland and China. It makes you
wonder what the same chart will look like at the end of 2099. Learn more about investing here!


