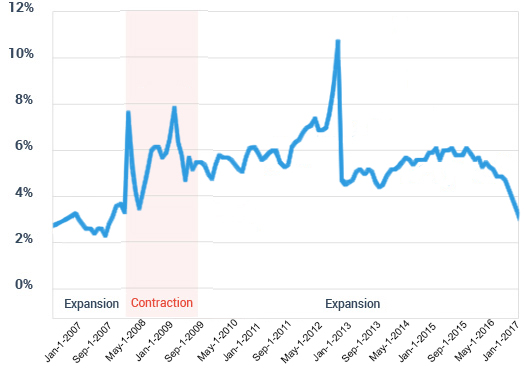
U.S. Personal Savings Rate
U.S. Personal Savings Rate
Why Economists Struggle
They struggle with the personal saving rate because it’s a derivative number — that is, it’s not measured directly. Instead, the Bureau of Economic Analysis derives the saving rate from other estimates. Here’s how it’s calculated:2
- The Bureau of Economic Analysis subtracts payroll and income taxes from personal income to get disposable personal income.
- The Bureau then subtracts its estimate of personal outlays — expenditures, interest payments, and payments — from disposable personal income to get an estimate of personal saving.
- The Bureau concludes by dividing personal income — the number the Bureau started with — by personal saving.
As currently structured, the U.S. Personal Saving Rate does not include capital gains from the sale of land or financial assets in its estimate of personal income. This effectively excludes capital gains — an important source of income for some.3
Fast Fact: Other Measure. Some economists prefer to track gross national savings as a percent of gross domestic product. In 2012, the latest year for which data is available, the gross national savings of the U.S. was 13.1%, below the world average of 18.7%.
Source: EconomyWatch.com, 2013
Another consideration is that the index includes contributions to qualified retirement accounts, such as IRAs and 401(k) plans, as a personal outlay. It does not consider IRAs or 401(k) plans personal savings.4
Gaining Insight
Gaining a bit of insight into a popular economic indicator can help you better understand trends as they are discussed in newspapers and websites. However, don’t let your long-term savings program be influenced by a national number.
Economic Indicator?
The saving rate trends higher when the economy is contracting and trends lower when the economy recovers.

Sources: Federal Reserve, 2013; for the period October, 2004 through September, 2013.
1,2. Federal Reserve, 2013
3,4. Federal Reserve, 2013, Bureau of Economic Analysis, 2013
The content is developed from sources believed to be providing accurate information. The information in this material is not intended as tax or legal advice. It may not be used for the purpose of avoiding any federal tax penalties. Please consult legal or tax professionals for specific information regarding your individual situation. This material was developed and produced by FMG Suite to provide information on a topic that may be of interest. The opinions expressed and material provided are for general information, and should not be considered a solicitation for the purchase or sale of any security. Copyright 2013 FMG Suite.


